Wednesday, September 28, 2016

SQL - Foreign Keys

Removing Obsolete Data

            One of my clients recently discussed their irritation at deleting obsolete records in parent tables that had many child table relationships. They had developed an extensive cleanup process to back-into their table relationships, deleting records from the child tables first then moving upwards in through the table relationships by following their database design charts. While I certainly understand that and similar methods, I think we can improve upon the process by designing databases more efficiently and changing some table designs. One thing I am going to cover here is the result of designing and altering tables to deter the initial problem. We know that due to referential integrity the parent-child relationship will be maintained by the database. So let us change the rules a little. We are going to discuss how to use ON DELETE CASCADE upon our FOREIGN KEYS and alleviate the problem of cleaning up our database of obsolete data connected with parent-child relationships.

Foreign Keys

The idea behind creating foreign keys is to develop relationships that connect tables together. Therefore, the first table (parent) has a column that references a column in another table (child). The column in the first table can also reference another column within itself (self-reference). The most common foreign key relationship we usually think of is the former one (parent-child).
Figure 1  Parent-Child relationship
Between store.employees2.DIVISION_ID and store.divisions.DIVISION_ID

           In Figure 1, we can see that the employee table has a Foreign Key column named EMPLOYEES2_FK_DIVISIONS connecting it to the division table Primary Key DIVISION_ID column.  In this way, these two tables are linked and related.

Figure 3 DIVISION table

We also see that listed in Figure 2, that the EMPLOYEE table has a foreign key named “EMPLOYEES_FK_DIVISIONS” in the R_CONSTRAINT_NAME column and the associated constraint named “DIVISIONS_PK” which obviously matches the DIVISIONS_PK constraint in the Figure 3 where the DIVISIONS table has it listed as the DIVISIONS table’s Primary_Key. Figures 4 & 5 illustrate the CREATE TABLE syntax under Oracle 11g used to create these tables.


Figure 4 SQL to create the table EMPLOYEES2


Figure 5 SQL to create the table DIVISIONS

 Deleting the Child Relationships Through the Parent Connection
A useful purpose that can be extended through the use of foreign keys is in the maintenance and cleanup of old data, the very point of this article. By using the ON DELETE CASCADE clause you can specify that through the FOREIGN KEY, that is, a Parent table which is having a row deleted, can act as the catalyst to allow any matching rows to be deleted in associated Child tables. After identifying these table relationships in your database design, you could write the following ALTER TABLE syntax (Figure 6) while you are in the creation mode to prepare for future maintenance ahead of time.


Figure 6 ON DELETE CASCADE

            By logically choosing the correct data flow, you can prepare your design to remove all associated records, that is child records, when a parent record is deleted. Consider a company that closes Division X after moving some employees to Division Y. When Division X is finally removed from the database, its Primary Key will drop and all associated Foreign Key relationships should drop as well. This is because the employee records still remaining and associated with Division X, drop as a result of the ON DELETE CASCADE.

            Play with this concept yourself in some test records that simulate your actual experience to get the concept clear in your mind. Then develop your new database with this concept in mind. Moreover, look at your current database and plan some table upgrades into your next iteration of software upgrades where this method of maintenance will streamline your database maintenance operations going forward.


Have an Insightful day!
Robert Majdak, Co-Founder
Crystal Majdak, Co-Founder
Management Insights

Sunday, September 11, 2016

SQL - Savepoints

Overview

Savepoints are a very handy feature in Oracle especially during development or data manipulation. The basic idea is that as a set of transactions are being accomplished; you can create a point in time to return the data without having to completely redo all work done. That is a tremendously valuable feature, let’s say you moved through 6 of 10 steps into your development process and decided you needed to only back track 1 step. With an intermittent savepoint in place, you can go backwards to that point into your development instead of rolling back all of your work in that session saving you valuable redevelopment time.

Here is How it Works

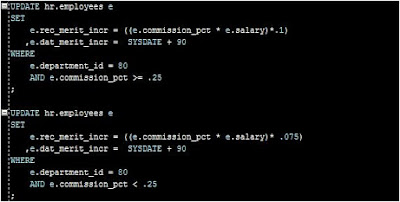
            I am going to setup some holiday pay bonuses now while I have plenty of time to consider how they hit our budget. For this discussion, I am going to limit the increases to department #80. The bonus is a function of a percentage of the employee’s salary and commission with the commission being used to decide the bonus multiple. The script used to populate the initial bonus data in the rec_merit_incr field of the employee table is shown in Figure 1.


Figure 1. Initial bonus data calculations.

            The commission breakpoint is .25 which decides whether an employee receives the .1 or the .075 bonus calculation. I would like to consider bumping the .075 up to .095 to get an updated sum for the holiday budget. Up to this point I have created new columns and populated data in support of the project. For the work so far set in place, I will create a SAVEPOINT named merit1 as shown in Figure 2. I name it in a way that another colleague will not likely create a similar SAVEPOINT name during this development session. Then I run the SAVEPOINT command.


Figure 2. Created SAVEPOINT.

      I will now continue the work by updating the calculation to .095 and running the SQL script for that subset of employees under consideration. You can easily see how employees like Christopher have a new merit increase test value. In aggregate, I decide that the increase for the entire employee subset is not yet budget supported so I return the data back to the original values in the system when SAVEPOINT merit1 was created.

Figure 3. Updating script and subsequent output.

Rolling back the data to the SAVEPOINT

            All I need to do to return the data to the pre-merit1 SAVEPOINT values is to enter the command into the system to rollback the data up to the merit1 SAVEPOINT. The system will then respond with "Rollback complete". See Figure 4.


Figure 4. Rolling back the data to the specified SAVEPOINT.

            We can then verify the data is in the correct state by verifying it using the script I used earlier before the .075 was changed to .095.


Figure 5. Data after the "ROLLBACK TO SAVEPOINT merit1" command.

Keep in mind that another scenario we could play out is to reduce other employees with higher bonus values or blend the subset with a budget compromising overall average. We might also consider budget-rebalancing ideas. Whatever the approach to be taken, we can use the SAVEPOINT feature in any transaction analysis to lockstep our way backwards as redevelopment dictates.

Video Highlights

Have an insightful day!
Robert Majdak, Co-Founder
Crystal Majdak, Co-Founder
Management Insights Team

Sunday, September 4, 2016

SQL – Pivot and Unpivot

Pivot
                                              
This week’s topic is aimed at understanding how database developers can deliver pivot and unpivot data orientation to data output. The Pivot and UnPivot clauses are new to Oracle Database 11g, the database that I am using in this article. The development environment I am using in the making of the screen captures is Oracle Developer Studio IDE. Often times Excel users need to take database output through reports they receive and massage it themselves in excel by creating pivot tables in order to view the data in a way that allows for identification of trends. For exactly the same purposes, we can do this across larger sets of data in the database itself leveraging its ability to process more complex code designs than otherwise practical in Excel. Further, it is possible to perform an aggregation function upon the data. In my example, I have an employee table where you will see that we have monthly salary and department data stored. Employee names and departments listed are meaningless for demonstration purposes. Following is the employee table, which we are going to pull the salary of each individual, and the department number that they are assigned. I minimized most of the unnecessary columns to show what we are really need. See Figure 1.

Figure 1 Employee Table

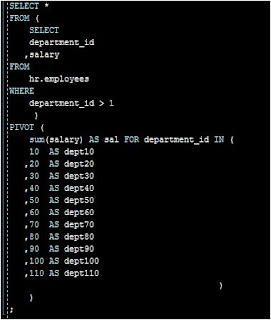
In the following sample script, I illustrate one way to write a very simple Pivot Clause. See Figure 2, Simple Pivot Clause.

Figure 2 Simple Pivot Clause

I am using a vertical format in my script strictly for illustrative purposes so you can follow my code and bracketing structure as easily as possible. The results produce cells that show the total salaries summed under each department in one row. See Figure 3.

Figure 3 Pivot Clause output

Unpivot

In preparation for this portion, I created a view we will query so we can unpivot the data shown in Figure 3. Here is one way to write a script to unpivot the data. The method I chose to unpivot is in the following script. See Figure 4.
Figure 4 UnPivot Clause

The SQL script results are much different than what we created in the Pivot Clause earlier. Now we have a vertical output listing each department in its own row with their adjacent salary totals. For organizational purposes, I then ordered the data in descending salary order. The output is shown in Figure 5.

Figure 5 Unpivot Clause output.

Depending on the user needs for information, you can greatly simplify the user experience using the Pivot and UnPivot Clauses in SQL. I hope this helps your understanding of Pivot and UnPivot in SQL coding projects you are called on creating in the future.


Insightfully yours,
Robert Majdak Sr., Co-Founder
Crystal Majdak, Co-Founder

Sunday, August 28, 2016

Time Management 201

The Next Step

Aimed at non-techy solutions

            Recapping the paper & pencil starting of Time Management 101. The reason is to reduce worry about the actual media used per se; rather, it is about changing your mindset about how you view your business time. There is an intentional separation of personal and business time. Without this separation, you become totally engulfed in the business and its stresses and demands. This will lead to burnout, exhaustion, bad decisions or indecision, negative physical symptoms, with the result being business and/or personal failure.

Starting with Color Coding (symbols later)

After a couple of weeks of penciling in your schedule and more importantly, being accustomed to the time management idea in general, it is time to add some new tricks. To facilitate “at a glance” visual interpretation of our planner I recommend adding visual cues to make things easier to recognize. You can do this with four-color inks pen sets that easily travel in the larger better quality planners I recommended before. I use Black for routine entries, Red for important “HOT” must do things, Green is used to line them out as complete telling me at a glance that that item is “good to go”, and Blue is used for any written and verbal communications such as emails, letters, and phone calls.

Prioritize

            Just by the sheer nature of implementing the color-coding system above, there is the forming of priorities easily recognized while glancing at the planner throughout the day. For one thing, Red has my attention all day until I line it out with Green. Blue tells me to try to get the door closed in order to focus on calls, emails and letters without interruptions. Everything else, in Black, is just my normal workflow.

Therefore, my To Do, Week at a Glance and Daily hour-to-hour notations are easier to identify as the day progresses. This method has helped me considerably in every high-touch job I ever had where the growing responsibilities began to overtake me. This tool allowed me to overtake it instead through development of adding visual organizational skills to my planning.

Beyond the Visual Enhancements

Rollovers. Rescheduling can be a useful tool that if not focused upon properly, can get out of hand and lead to loss of time management control. Not that this will not happen occasionally, but if not handled efficiently, can ruin your time management progress. So limit your acceptance of Rollovers. There are some ways to do this.

First, identify likely rollover projects and tasks then solicit assistance when they are created. The more hands available to keep the project moving, the easier it is to get it done. The sharing of the responsibilities and the rewards should not inhibit you. As a leader, your job is to get things done, not do everything that needs to be done. See the difference? If not, call me, email me, reach out and let me help you through this concept. It is vital!

Second, limit the amount of Rollovers to a number each week. Try a high bar, no more than one per week. If you find after a month you seem to get two to three, lower the bar to just two. The idea is to sharpen your time management skills, not give in to their lack of development. After two months try to raise the bar back to one. Under no circumstances should you accept three. If you are struggling with three or more then again, call me, email me, reach out and let me help you through this concept. It is vital! Remember, we are working on time management, as a business leader, this is worth getting right. Moreover, I want you to go home at the end of the day without the Rollover stress haggling you all night and stressing you out in the morning commute.

Higher Priority. Big projects that start as high priority and those that move into that category over time (rollovers, especially, multiple rollovers) need to be more than Red items. They must be of prime concern to you and if they are important to you they are important to any team member you can solicit help from too. Remember, your job, to get things done. No matter what portion of it is yours to do hands-on, there are other people that can supplement because they do something better than you do and that is why they are your employee and/or your team member. Corn does not grow in the silo. It takes many hands to get it there and even then, is made productive only when it leaves. Don’t get it? Then call me, email me, reach out and let me help you through this concept. It is vital!

Transitional Time. One of the greatest number of errors I see on executive planners is back-to-back items. There are good reasons for listing some that way. For instance, you are scheduling yourself to take lunch at noon-1pm then be in the office from 1-2pm and you want to make calls from 1-1:30pm and write emails from 1:30-2pm. That is all good. Just do not let me catching you scheduling a staff meeting from 2-3pm. Because unless you have the post lunch water retention of a camel those two cups of coffee are going to be making you very uncomfortable and somewhat irritable during that staff meeting. Make transitional breaks to the restroom. Seems silly but I cannot count the number of times I have seen people escape mid-meeting on account of poor post lunch planning. My argument is this, if you cannot plan your own time for personal needs, what makes me think confidently about your critical role on my team? Enough said.

Notes Filing, post-meeting. Here is my calculation for an organized office run by an organized leader.


If there is some part of this calculation that seems confusing, call me, email me, reach out and let me help you through this concept. It is vital! I am going to raise the bar again on this on another day and introduce more organizational tools to help you. For now, let’s try this for a few weeks and see how you do.


Insightfully yours,
Robert Majdak, Co-Founder
Crystal Majdak, Co-Founder

Sunday, August 21, 2016

Burn Rate

Burn Rate and Cash Monitoring

            Burn Rate is a dot-com era term used to describe, in financial terms, the various stages a startup company goes through before achieving profitability while concurrently maintaining a sustainable level of operating cash. To be self-sustainable is to be working with net positive cashflows. Achieving this level makes the case easier for future funding efforts if additional resources are needed for the next level of growth. Unfortunately, many businesses operate in a manner in which their setup and continuous operations lead to a cash zero date certainty. Therefore, it is best to understand the burn rate and aggressively design the business to defeat the burn rate and achieve sustainability as to make the next funding round an option for business growth instead of a matter of survival.

            Burn rate therefore, measures the company’s sustainability and how practical it may be to invest into it. It is best then, to focus on solving the operating cash cycle throughout the financial periods. I offer a spreadsheet analysis on this topic in Fig 1.

Sustainable
Unsustainable
Operating revenues cash receipts:
Beginning revenue-driven receivables $
500,000
500,000
Sales, both cash and credit on income statement
5,000,000
2,500,000
Total
5,500,000
3,000,000
Less ending revenue-driven receivables
600,000
600,000
Total
4,900,000
2,400,000
Add ending balance of unearned revenues (a)
50,000
50,000
Total
4,950,000
2,450,000
Less beginning balance of unearned revenues
100,000
100,000
Cash collected for revenues (b) $
4,850,000
2,350,000
Cash paid for cost of goods sold:
Ending inventory $
400,000
400,000
Cost of goods sold on income statement
3,000,000
3,000,000
Total
3,400,000
3,400,000
Less beginning inventory
350,000
350,000
Total
3,050,000
3,050,000
Add beginning inventory-related payables
200,000
200,000
Total
3,250,000
3,250,000
Less ending inventory-related payables
150,000
150,000
Cash paid for cost of goods for resale $
3,100,000
3,100,000
Cash paid for any expense:
Beginning accrual $
15,000
15,000
Any expense on income statement
40,000
40,000
Total
55,000
55,000
Less ending accrual
10,000
10,000
Total
45,000
45,000
Add ending related prepaid amount, if any
10,000
10,000
Total
55,000
55,000
Less beginning related prepaid amount, if any
5,000
5,000
Cash paid for expense item $
50,000
50,000
Notes:
a Customers Advance Payments
b Whether Earned or Not
Burn-Rate
Gross
3,150,000
3,150,000
Net
1,750,000
(750,000)
Positive Cash Flow/ (Burn Rate) - Per Month
145,833
(62,500)
Cash Reserve
1,000,000
Sustainable for xMonths - 1 Month
-15


Figure 1. Sustainable versus Unsustainable

            In the sustainable business case, the business operations result in a net positive cash accumulation of $145.8K per month. Developing a business case to invest for business growth is an easier task than the unsustainable business case. In the unsustainable business case, which might be correctable, operations must focus on course correction. This business has a cash burn rate of $62.5K per month which if left unchecked means that its $1M cash reserve will be consumed in 16 months. In its 15th month, if not corrected, will need to be well on its way in executing its exit strategy.

            The concept of burn rate, while useful as a tool for past performance over a set of periods, for instance, the last 12 months, would also be useful as an operational dashboard gauge. For one of our clients, this tool became the means in which cash consumption versus cash reserves and operating cash balance was monitored. With cash being king, this gauge can become useful in setting operations decisions.

Video Highlights

Insightfully yours,
Robert Majdak Sr, Co-Founder
Crystal Majdak, Co-Founder
Management Insights Team